
A reference compilation drawn entirely from primary public sources. Last updated May 2026.
The headline finding
As of May 2026, Linux runs on 61.1% of all websites for which the underlying operating system can be identified, while Unix-family systems collectively account for 91.5% (W3Techs, May 2026). On supercomputers, Linux’s share is absolute: 100% of the TOP500 list since November 2017, a position re-confirmed in the November 2025 list (TOP500.org). Microsoft’s own product page reports that more than 60% of customer cores in Azure run Linux workloads (Azure Virtual Machines: Linux, 2026). Linux dominance is not a single number; it is a pattern that holds across web servers, supercomputing, and the major cloud platforms.
|
Why this article exists. There is no shortage of “server OS market share” pages on the web. Most are rewrites of the same handful of primary sources, with thin attribution and no methodology disclosure. This page tries to do the opposite: cite the primary publishers directly, state what each source actually measures, give the date the figure refers to, and flag where two reputable sources disagree. Anything that cannot satisfy those four checks is not in this piece. |
How server OS share is measured
A reader who has spent any time researching server operating system share quickly notices that the numbers do not agree. One source reports Linux at 61% of websites, another at 45% of the global server OS market, a third at 100% of supercomputers, a fourth at 60% of cloud VMs. None of these is wrong. They measure different things.
Four data sources do most of the work in this debate, and they do not measure the same thing as each other:
- Public web servers: what runs on the servers behind the world’s websites. W3Techs is the dominant primary source.
- Server OS revenue and shipments: what enterprises buy as commercial server OS subscriptions. IDC’s Worldwide Server Tracker is the standard, but is gated; only its press release figures appear free.
- Cloud workloads: what runs on virtual machines inside AWS, Microsoft Azure, and Google Cloud. The cleanest free data points are statements made by the cloud providers themselves.
- Developer preference: what developers run on their own machines for work. Stack Overflow’s annual Developer Survey is the canonical source here. It measures preference, not production deployment.
Treating these as one number, or pretending they answer the same question, is the most common failure mode in articles on this topic. The rest of this piece keeps them separate.
Linux vs Windows on public web servers
W3Techs (run by Q-Success GmbH in Austria) crawls a fixed sample of the top 10 million websites and counts the operating systems it can identify from server response headers and other public signals. It updates monthly. Three methodology notes apply.
First, W3Techs reports OS share only among sites where the OS can be identified. A growing share of the public web sits behind reverse proxies and content delivery networks (most prominently Cloudflare), which mask the underlying server. Sites whose OS cannot be identified are excluded from the percentage base, not counted as Windows or Linux.
Second, a single website can use more than one server operating system across its infrastructure. W3Techs counts each identified OS separately, so the family-level percentages can sum to slightly more than 100% (the 91.5% Unix and 8.7% Windows figures below add to 100.2% for this reason).
Third, the Linux distribution data has the same identification constraint as the OS-level data, and is sharper still: most Linux sites do not advertise their distribution at all.
With those caveats stated, the May 2026 figures from W3Techs are:
|
Operating system family |
Share of identified-OS sites |
Note |
|
Unix (incl. Linux, BSD, macOS, Solaris) |
91.5% |
Aggregate Unix family, May 2026 |
|
Linux (subset of Unix) |
61.1% |
Of all websites with identified OS |
|
Windows |
8.7% |
Published directly by W3Techs alongside Unix; sums to 100.2% with Unix because of multi-OS sites |
Source: W3Techs, Usage Statistics and Market Share of Operating Systems for Websites (May 2026), and the Linux subset breakdown at Usage Statistics and Market Share of Linux for Websites. Methodology: W3Techs FAQ.
The trajectory matters more than the snapshot. W3Techs has tracked Linux share on the public web on a monthly basis for over a decade. The direction has been one-way: Linux up, Windows down, with the most rapid decline in Windows share occurring as more public-facing infrastructure has moved behind cloud-fronted proxies and Linux-based reverse proxies.
Which web server software runs on those servers
The OS is only half the picture; the web server software on top of it is closely correlated. As of May 2026 (W3Techs):
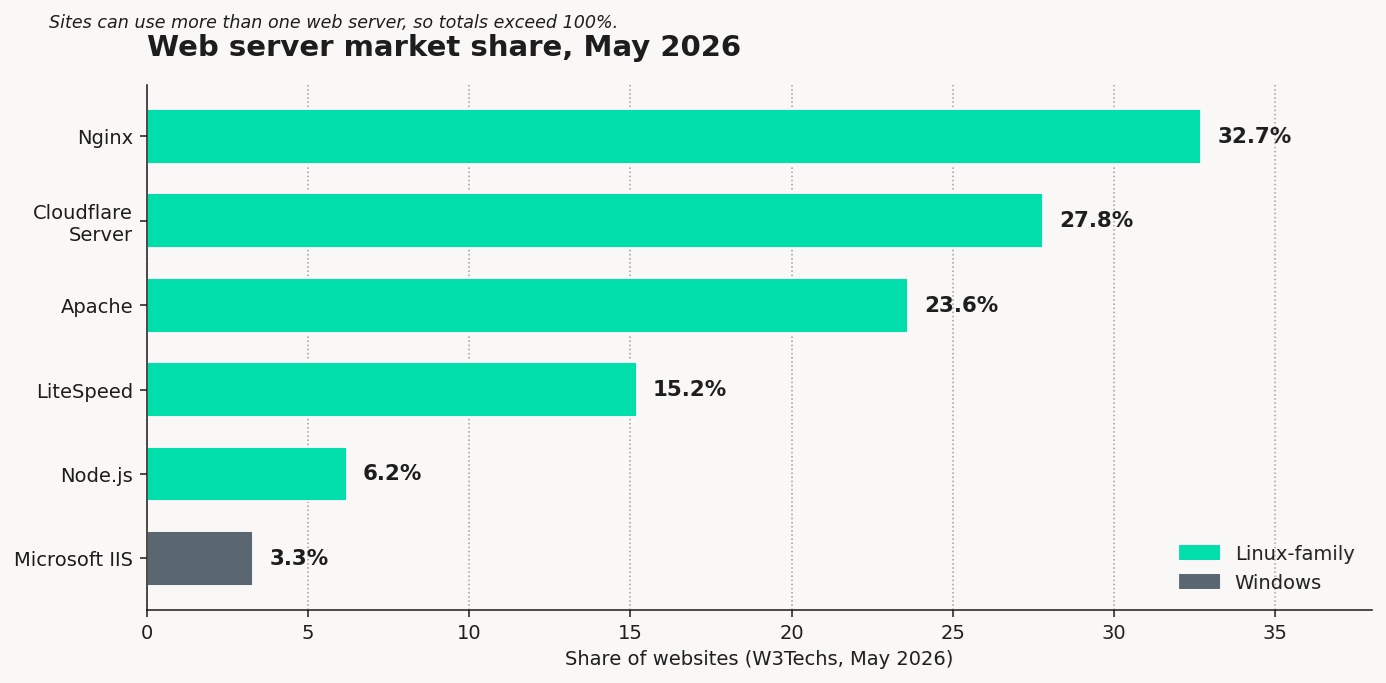
Source: W3Techs, Usage Statistics and Market Share of Web Servers (May 2026). Sites can use more than one web server, so totals exceed 100%.
Two observations are worth pulling out. The four leading web servers (Nginx, Cloudflare Server, Apache, and LiteSpeed) all run primarily on Linux, and together account for roughly 99% of the web-server-identified market. Microsoft IIS, the only mainstream Windows-based web server, sits at 3.3% and has been declining for years. The web server software market is not split between Linux and Windows; it is a Linux market with a small Windows niche.
Which Linux distributions run on web servers
When a Linux website does identify its distribution, here is the breakdown W3Techs reports as of May 2026.
|
Linux Distribution |
Share of Linux sites |
Notes |
|
Ubuntu |
14.9% |
Canonical; most common identified distro |
|
Debian |
6.3% |
Upstream of Ubuntu |
|
CentOS |
1.4% |
EOL upstream; replaced by Stream, Rocky, AlmaLinux |
|
AlmaLinux |
0.3% |
CentOS-replacement; rising |
|
Amazon Linux |
0.2% |
AWS-only distribution |
|
Rocky Linux |
0.2% |
CentOS-replacement; community-led |
|
Red Hat Enterprise Linux |
0.2% |
Commercial; enterprise-heavy |
|
CloudLinux |
0.1% |
Shared hosting use case |
|
Unknown / unidentified |
76.3% |
Largest single category |
Source: W3Techs, Usage Statistics and Market Share of Linux for Websites (May 2026).
The 76.3% Unknown share is the most important number on this table, and the one most aggregator pages quietly drop. It means the published distribution percentages reflect only the minority of Linux sites that disclose their distribution; the majority are silent. Treat any specific distribution-share claim with that limitation in mind.
Two further observations. Debian-derived distributions (Ubuntu plus Debian) account for the vast majority of identified Linux deployments, making the Debian family the de facto default on the web. Red Hat’s direct identifier sits at 0.2%, which understates its enterprise footprint significantly: Red Hat deployments often sit behind reverse proxies and load balancers that mask the underlying distribution, and W3Techs only counts what it can see.
Supercomputing: 100% Linux, eight years running
The TOP500 project, which has ranked the 500 most powerful publicly-known supercomputers twice a year since 1993, has reported every system in its list as running Linux for every list since November 2017. The November 2025 list, the 66th TOP500 edition, confirmed this for the seventeenth consecutive ranking.
The shift was decisive but not instant. In the late 1990s, commercial Unix variants (IRIX, AIX, Solaris, UNICOS) dominated the list. Linux first appeared on the TOP500 in 1998 with a single system and grew steadily through the 2000s, with the most rapid acceleration between 2002 and 2009. By 2017, the final two non-Linux systems dropped off and were not replaced. Eight years on, no challenger has emerged.
Source: TOP500 List — November 2025. Historical OS share: TOP500 Statistics — Operating System Family.
Why does this matter for someone planning a VPS deployment? Supercomputing is not VPS, but the OS choice that all 500 leading high-performance computing centres make, year after year, reflects an underlying preference for predictability, customisability, and cost structure that scales down to commodity VPS workloads. The same case the supercomputing centres make for Linux applies, in compressed form, to a single virtual server.
Cloud workloads: Linux is the majority on Azure too
Cloud workload share is the area where third-party data is weakest and primary statements from the cloud providers themselves are strongest. The cleanest single figure available comes from Microsoft, on the Azure product page itself.
|
“More than 60% of customer cores in Azure run Linux workloads.” — Microsoft, Azure Virtual Machines: Linux product page, 2026. |
That statement is striking because Microsoft owns Windows. The fact that the company’s own cloud platform now runs more Linux than Windows is a structural signal about where production deployment has moved. AWS and Google Cloud have made similar public statements over the years; Linux’s majority position on AWS and on Google Cloud has been the working assumption of cloud architects for the better part of a decade. No major cloud provider currently makes the opposite claim.
Source: Microsoft, Linux virtual machines in Azure (accessed May 2026). Methodology note: Microsoft does not publish the precise methodology behind the figure on the page itself, so it should be read as a directional claim from a primary source rather than a precise benchmark.
Developer preference vs production reality
The Stack Overflow Developer Survey is the most-cited primary source on developer operating system preference. The 2025 edition received 49,000 responses across 177 countries, of which 31,569 answered the operating system question. A critical caveat applies before quoting any number from it: this is what developers run on their own machines, not what is in production.
The 2025 results, for primary operating system in personal use and professional use, are shown below.
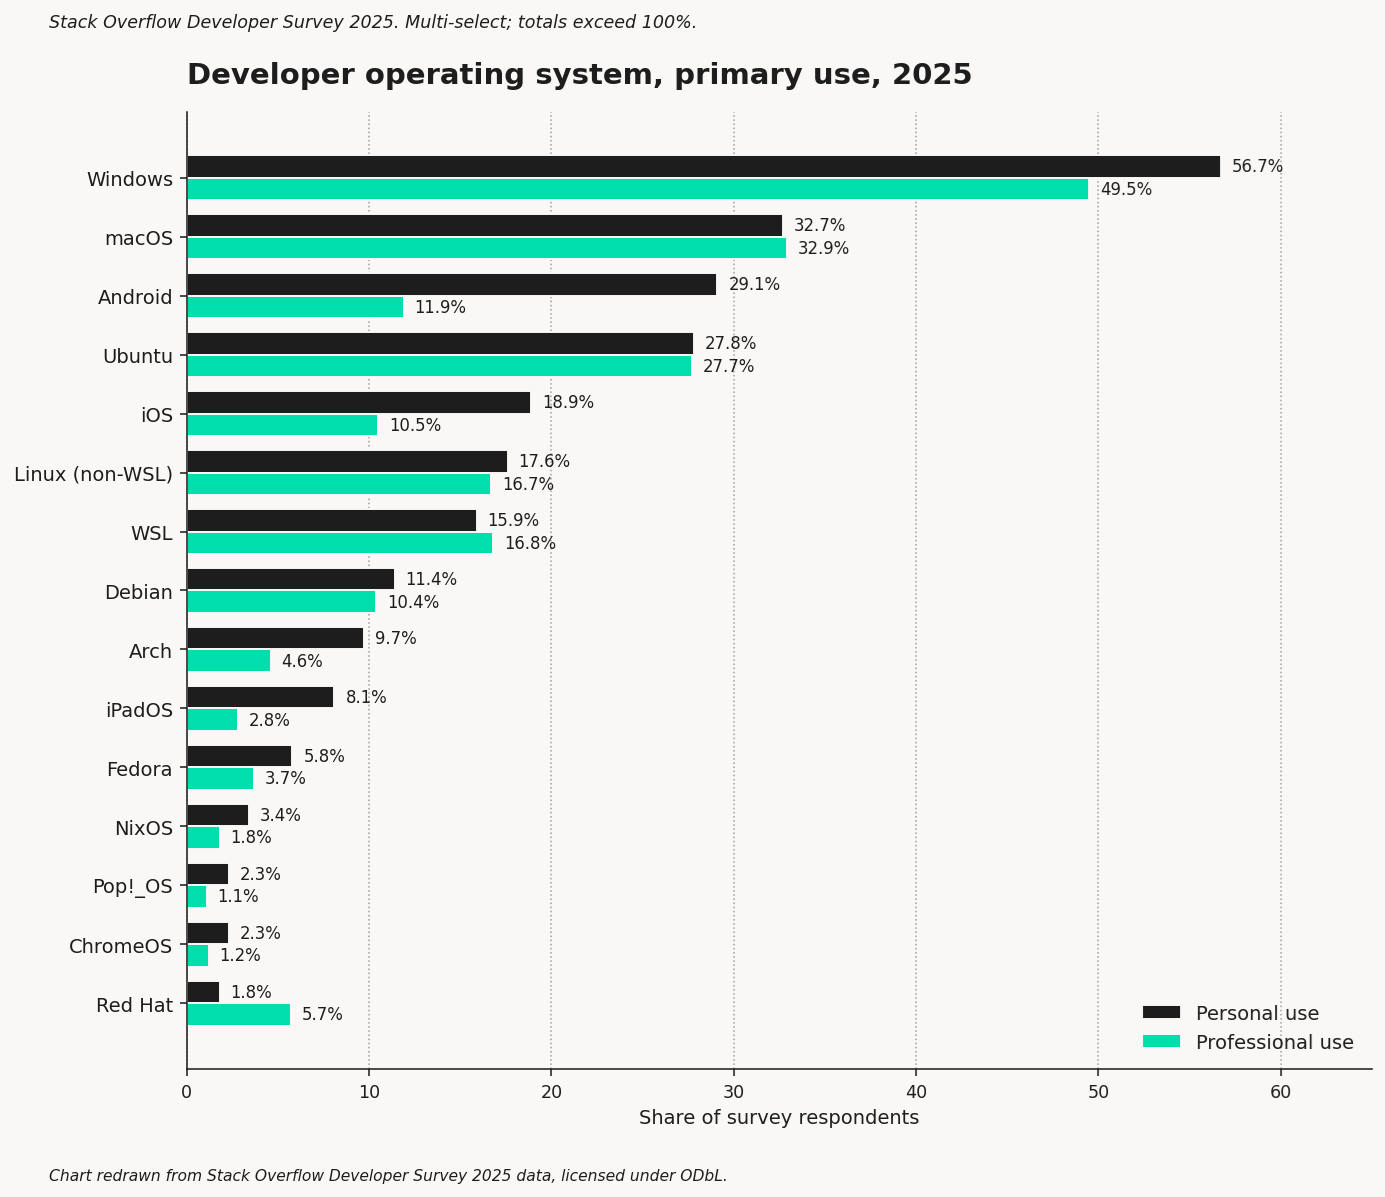
Respondents could select more than one OS, so column totals exceed 100%. Source: Stack Overflow, 2025 Developer Survey — Technology. Based on 31,569 responses to this question (64.4% of survey respondents). Chart redrawn from the published survey data, which is licensed under the Open Database License.
The pattern reveals two things at once. First, individual Linux distributions (Ubuntu, Debian, Arch, Fedora, Red Hat) when added together materially out-share Windows on the developer machine; the developer ecosystem is more Linux-leaning than the headline Windows figure suggests. Second, the gap between developer machines (where Windows leads) and production servers (where Linux leads) is real and large. The gap exists because Windows developers routinely deploy Linux servers; many do so via WSL, which lets them run a Linux environment inside Windows.
A specific 2025 finding worth flagging: Red Hat’s share is more than three times higher in professional use (5.7%) than in personal use (1.8%). This is the clearest single signal in the survey of a distribution that is bought rather than chosen; Red Hat Enterprise Linux is overwhelmingly an enterprise procurement decision, not a developer preference.
Where reputable sources disagree, and why
It is common to encounter server OS share figures ranging from 14% to 96% Linux on the same web search. The wide range is not contradiction; it is methodology divergence. The most-quoted divergent figures come from these sources:
|
Source |
What it actually measures |
Typical figure |
|
W3Techs (free, public) |
Public-facing web servers in top 10M sites with identifiable OS |
Linux 61% of identified sites |
|
Cloud-provider statements |
VM cores running Linux on AWS, Azure, GCP |
60%+ Linux on Azure cores |
|
IDC (paid; press releases free) |
Server OS revenue (commercial subscriptions) |
Linux ~45% of server OS market |
|
Stack Overflow Developer Survey |
Self-reported developer machine OS |
Windows 49.5% professional use |
|
TOP500 |
Top 500 supercomputers |
Linux 100% |
|
Vendor-tracking aggregators (BuiltWith, 6sense, SimilarTech) |
Customer counts using vendor technologies |
Wide variance; methodology proprietary |
Two practical rules follow. First, never compare a W3Techs percentage to an IDC percentage as if they answer the same question; they do not. W3Techs is counting servers, IDC is counting commercial license revenue. Second, treat headline numbers from vendor-tracking aggregators as directional only. Their methodology is proprietary, their denominator differs from W3Techs’, and their figures often diverge sharply.
What the data means for VPS decision-makers
A VPS is, in effect, a small slice of a server. The same OS choices that decide what runs on the public web, what runs on hyperscale clouds, and what runs on the world’s supercomputers, decide what runs well on a single virtual server. For someone planning a VPS deployment (whether an SME architect choosing infrastructure or an in-house technical lead specifying a stack) three implications matter.
- Linux VPS is the default for almost everything except .NET. If a workload doesn’t specifically require Windows Server (most often: ASP.NET classic, certain enterprise Microsoft applications, or specific Active Directory integrations), Linux VPS is the safer, cheaper, and more widely-supported choice. The web server software ecosystem (Nginx, Apache, LiteSpeed) is built around Linux first.
- Distribution choice is less consequential than many planners think, but the right default helps. At VPS scale, performance differences between Ubuntu, Debian, AlmaLinux, and Rocky Linux are small for typical workloads. The practical guidance: choose Ubuntu as the safe default unless you have a reason not to (it has the largest tutorial corpus, the broadest support community, and the longest security update cycles for free); choose AlmaLinux or Rocky Linux if your team is Red Hat-trained or if your application expects a Red Hat-family environment; choose Debian if minimalism and stability outrank ecosystem size.
- Windows VPS has a real but specific niche. The 3.3% IIS share is not a sign that Windows is unsuitable; it is a sign that the workloads which require Windows are a defined subset of the market. If your application stack includes legacy ASP.NET, Microsoft SQL Server in a Windows-licensed configuration, or specific Microsoft authentication patterns, Windows VPS is the right choice. Otherwise, Linux VPS is.
A more detailed walkthrough of which workloads call for Linux versus Windows will follow in a companion piece on this blog. [Link to be added on publish: Article 2 — Workload-to-OS Fit.]
Source notes and methodology
Every figure in this article was verified on the source page itself at the time of writing. If a number cannot be reproduced from the source pages below, please flag it via Websouls support; corrections matter more than appearances.
|
Source |
URL |
What we cited |
|
W3Techs — OS for websites (May 2026) |
w3techs.com/technologies/overview/operating_system |
Unix 91.5%, Windows 8.7% |
|
W3Techs — Linux details (May 2026) |
w3techs.com/technologies/details/os-linux |
Linux 61.1%; distribution split; 76.3% unidentified |
|
W3Techs — Web servers (May 2026) |
w3techs.com/technologies/overview/web_server |
Nginx, Cloudflare, Apache, LiteSpeed, IIS shares |
|
Stack Overflow Developer Survey 2025 |
survey.stackoverflow.co/2025/technology |
OS by personal vs professional use; based on 31,569 responses |
|
TOP500 — November 2025 list |
top500.org/lists/top500/list/2025/11/ |
100% Linux on the 66th edition |
|
Microsoft Azure Linux VMs product page |
azure.microsoft.com/en-us/products/virtual-machines/linux |
60%+ Linux cores on Azure |
Methodology notes by source:
W3Techs surveys the top 10 million websites monthly and reports OS share only among sites where the OS can be identified; sites behind reverse proxies and CDNs may be excluded, and a single site may be counted under more than one OS family. Stack Overflow Developer Survey is self-reported and weighted toward developer machine usage rather than production deployment. TOP500 ranks the world’s 500 most powerful publicly-known supercomputers, twice a year. Microsoft’s Azure Linux figure comes from the company’s own product page; precise methodology is not published and the figure should be read as a directional primary-source statement.
Sources we deliberately did not use:
Aggregator stat pages (CommandLinux, TrueList, and similar) republish primary data with thin attribution; we cite the primary publishers directly. Paid market research firms (Fortune Business Insights, Mordor Intelligence, IDC full reports) sit behind paywalls; their press release figures are free but were not needed for the questions this article answers. Wikipedia is excellent for source discovery but not citable as a primary source.
Update Cadence
This article is reviewed every six months and refreshed annually with each year’s W3Techs and Stack Overflow data. Last review: May 2026. Next scheduled review: November 2026.

.png&w=1920&q=75)